Websites have errors, which are ideally logged. Logging though is one thing, you also need to make some sense out of them.
In an ideal world you would have some logging server like graylog or similar. Sadly this is not avaiable on every site.
Here is an example of just looking at error messages stored in the database, but the general toolsuite could be applied to everything.
Get the data
We use drush to fetch the error messages from drupal:
drush watchdog-show --count=1000000 --type=php --format=json > errors.jsonThis writes out all PHP entries in watchdog into the errors.json file. Of course you could use SQL for that as well, but who isn’t lazy.
Look at the data.
We have the data as json, which is super nice. Of course we could use PHP or any other scripting language and iterate over all entries to make sense out of them, but is that elegant, not really.
Let`s use python for that!
There is a package called pandas, which pretty much gives you the same kind of operations to data like SQL for any kind of data source. (SQL, CSV, JSON etc.).
First load the data into pandas:
import pandas as pd

result = pd.read_json("errors.json", orient="index")
Result is a thing called dataframe, which is basically an enhanced array/hashmap.
This allows you to do some simple things:
- Show the available keys:
result.keys():Index([u'date', u'hostname', u'link', u'location', u'message', u'referer', u'severity', u'type', u'uid', u'wid'], dtype='object') - Select a specific column:
result['wid'] - Select multiple columns:
result[['message', 'wid']] - Select a specific row:
result[509247] - Count the amount of rows:
result.count(). This method counts column, but you can combine it with selecting a specific column:result[['wid']].count()
Now we want to know which error message appeared how often. Therefore pandas offers grouping the result.
result.groupby('message')This gives us an array of dataframes, one for each possible message, which you can work with again:
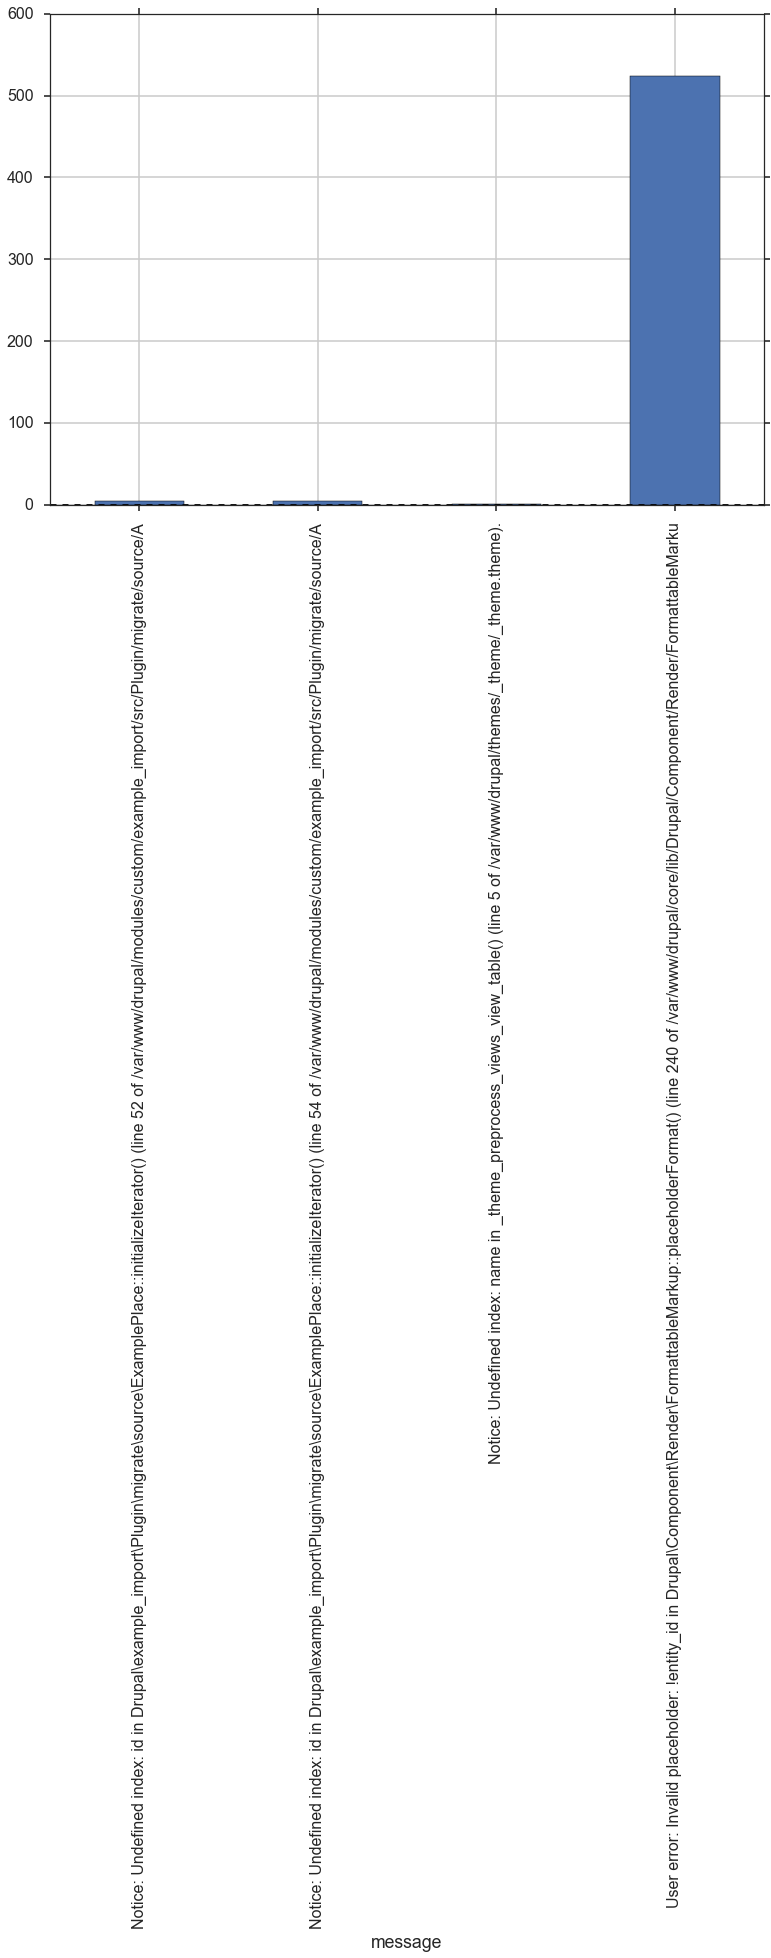
count_by_message = result.groupby('message').count()['wid']Visualization
And if you really want you could even visuallize it, if you want:
count_by_message.plot(kind="bar")