From time to time one runs into some performance problems, for example in PHP applications. The request might be slow or a batch process is leaking memory.
Here I will describe some setup used with ddev but the general setup can be adopted to any other PHP setup.
Note: There are at least two cloud services out there providing profiling for PHP
Both are great and I recommend using them, this blog post though describes a setup which runs all locally.
Setup
We will use the php-xhprof-extension project, which is a fork for the old facebook project called xhprof. Tideways continues to maintain this extension and updates it to modern PHP versions.
In order to install it, you have to manipulate the ddev docker file:
.ddev/web-build/Dockerfile

ARG BASE_IMAGE=drud/ddev-webserver:v1.12.1
FROM $BASE_IMAGE

RUN TEMP_DEB="$(mktemp)" && wget -O "$TEMP_DEB" 'https://github.com/tideways/php-xhprof-extension/releases/download/v5.0.2/tideways-xhprof_5.0.2_amd64.deb' && sudo dpkg -i "$TEMP_DEB" && rm -f "$TEMP_DEB"
On top of that you need to enable the php extension:
.ddev/php/my-php.ini

extension=/usr/lib/tideways_xhprof/tideways_xhprof-7.3.so
After restarting ddev once (ddev restart) you need to set up tideways inside the PHP application itself. In your main entry point wrap your application with the following statements:
<?php

\tideways_xhprof_enable(TIDEWAYS_XHPROF_FLAGS_MEMORY | TIDEWAYS_XHPROF_FLAGS_CPU);
$file = sys_get_temp_dir() . DIRECTORY_SEPARATOR . uniqid() . '.myapplication.xhprof';

// ... actual application

file_put_contents(
    $file,
    serialize(tideways_xhprof_disable())
);
Now run your application and you end up with
When you run your application now you end up with .xhprof files in /tmp.
Copy the file you are interested in out of the container:
mkdir traces
docker cp ddev-symfonydemo-web:/tmp/5dec2a3622b15.myapplication.xhprof traces/
Analysis
Now that we have the xhprof information in a file we want to analyse that. One really simple way I found was using a docker container which hosts the xhprof viewer for you, without any further work. I created a small script for ease of access:
#!/usr/bin/env bash

cd $(dirname "$0")

echo "Usage: xhprof-ui-run.sh PROJECTDIR"
echo "Running xhrpof UI on 3731"
docker run --rm -p 3731:80 --name jeromebreton-xhprof-simple-viewer -v "$1/traces":/traces jeromebreton/xhprof-simple-viewer

cd -
With this script I can quickly launch a user interface:
$ cd symfony_demo
$ xhprof-ui-run.sh `pwd`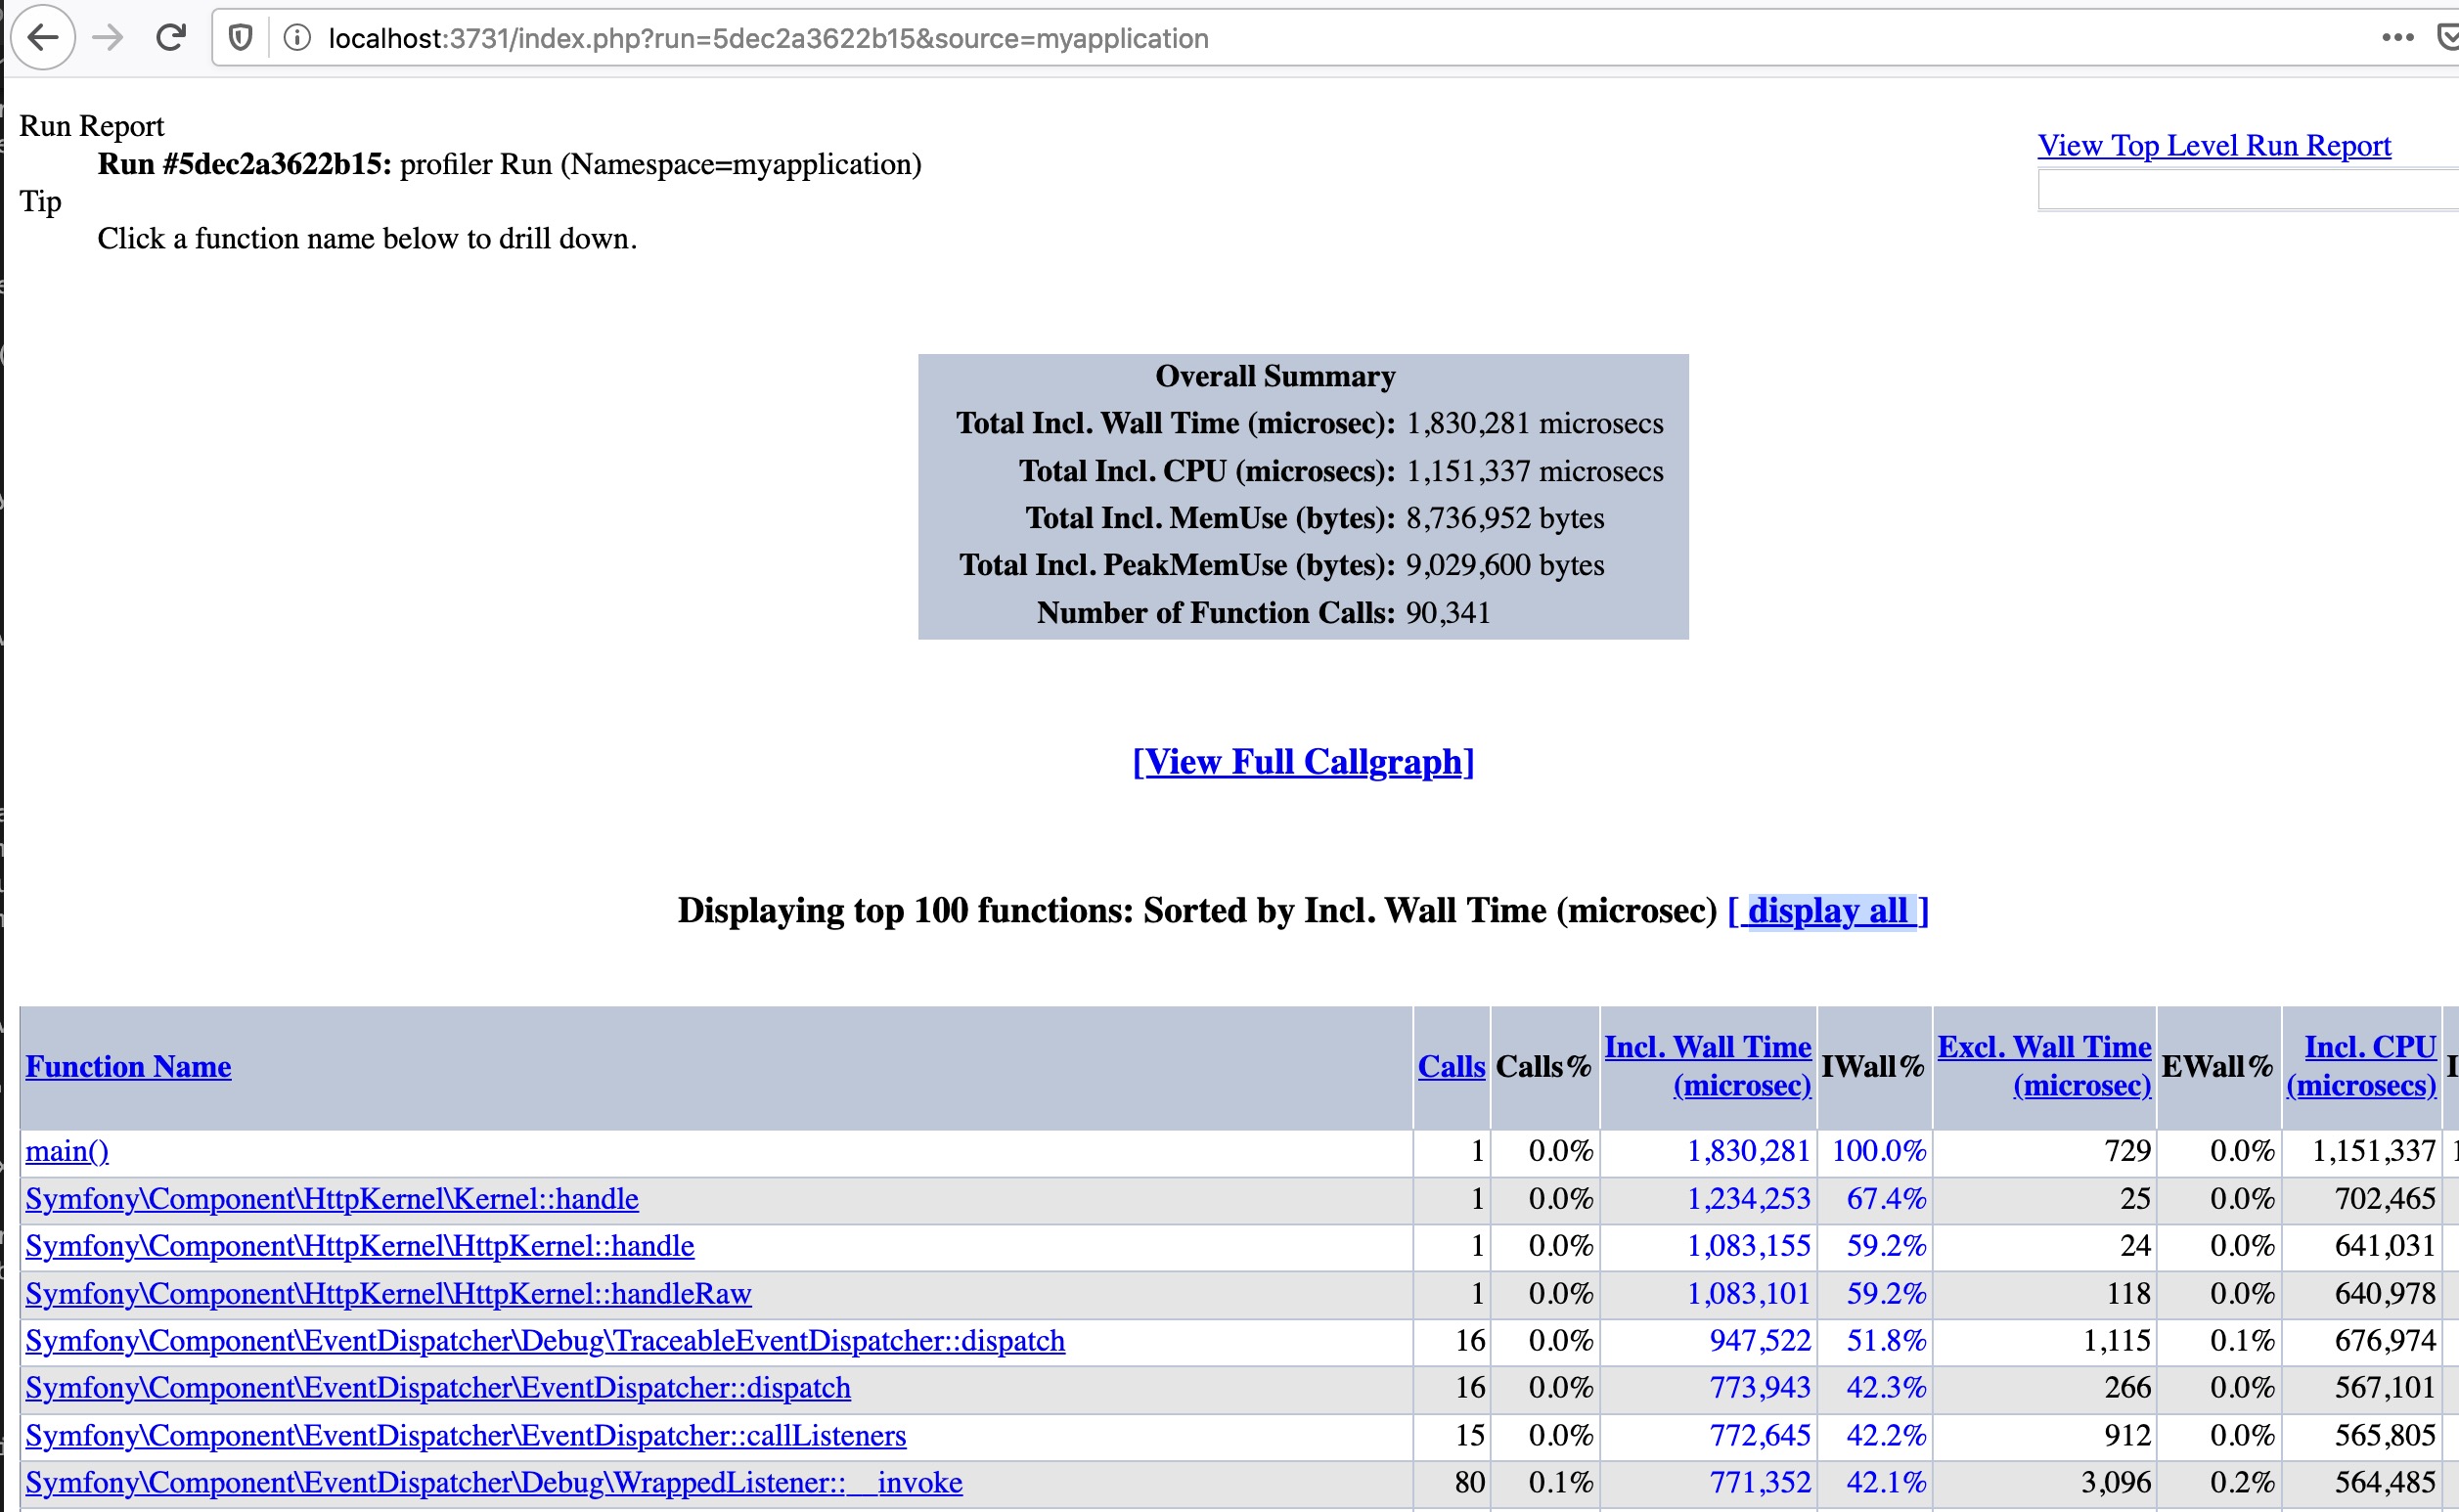
Displaying a single PHP profile
Feedback
Let me know how you approach profiling in PHP or other languages, which methodologies / tools are you using.